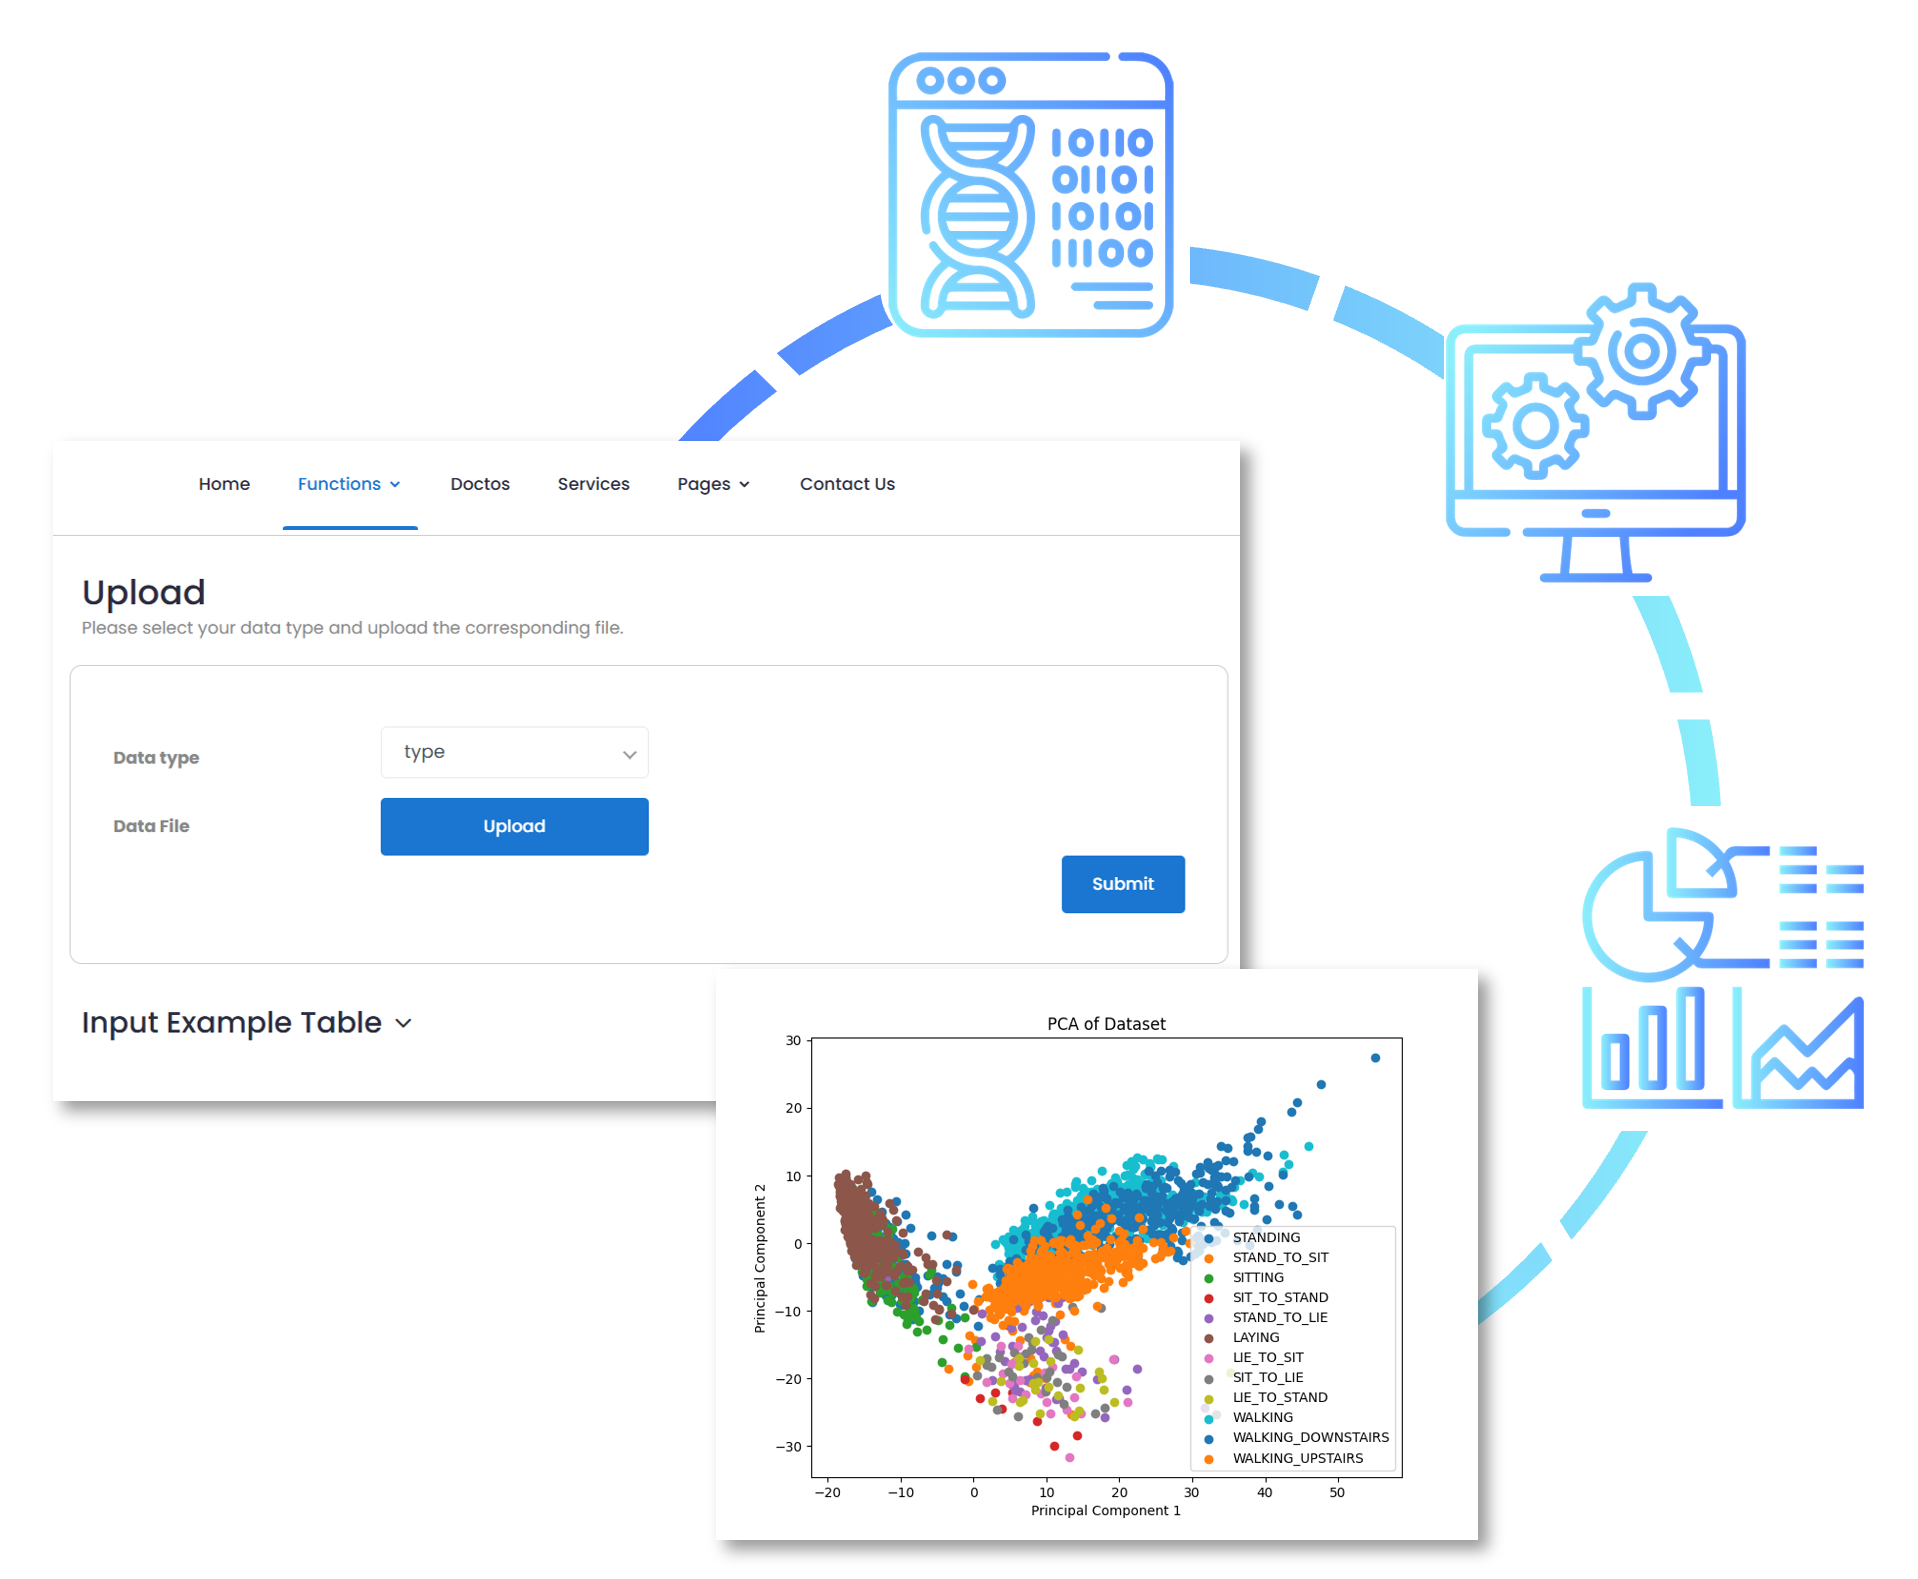
Upload
Easily upload your dataset in common formats such as CSV or Excel to begin your analysis.
Easily upload your dataset in common formats such as CSV or Excel to begin your analysis.
Customize your workflow: preprocessing data, select models and generate reports.
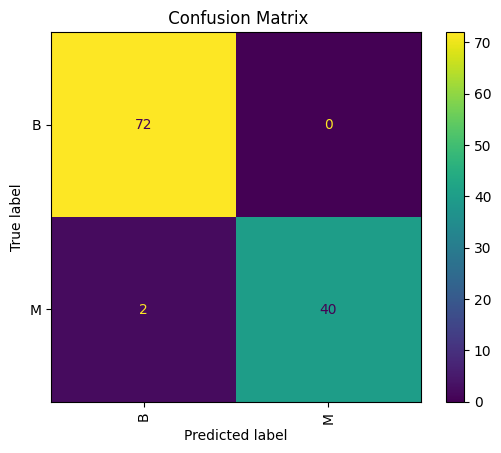
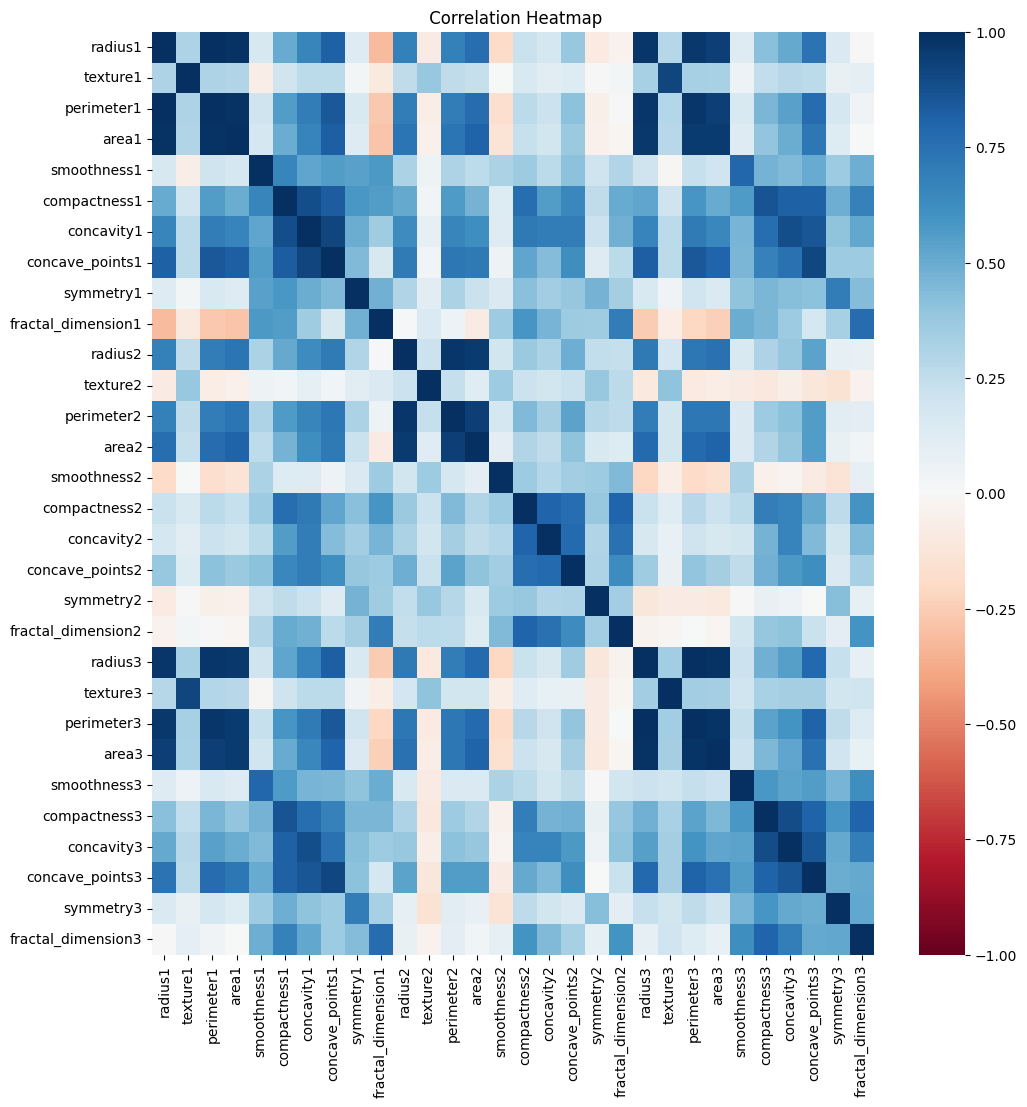
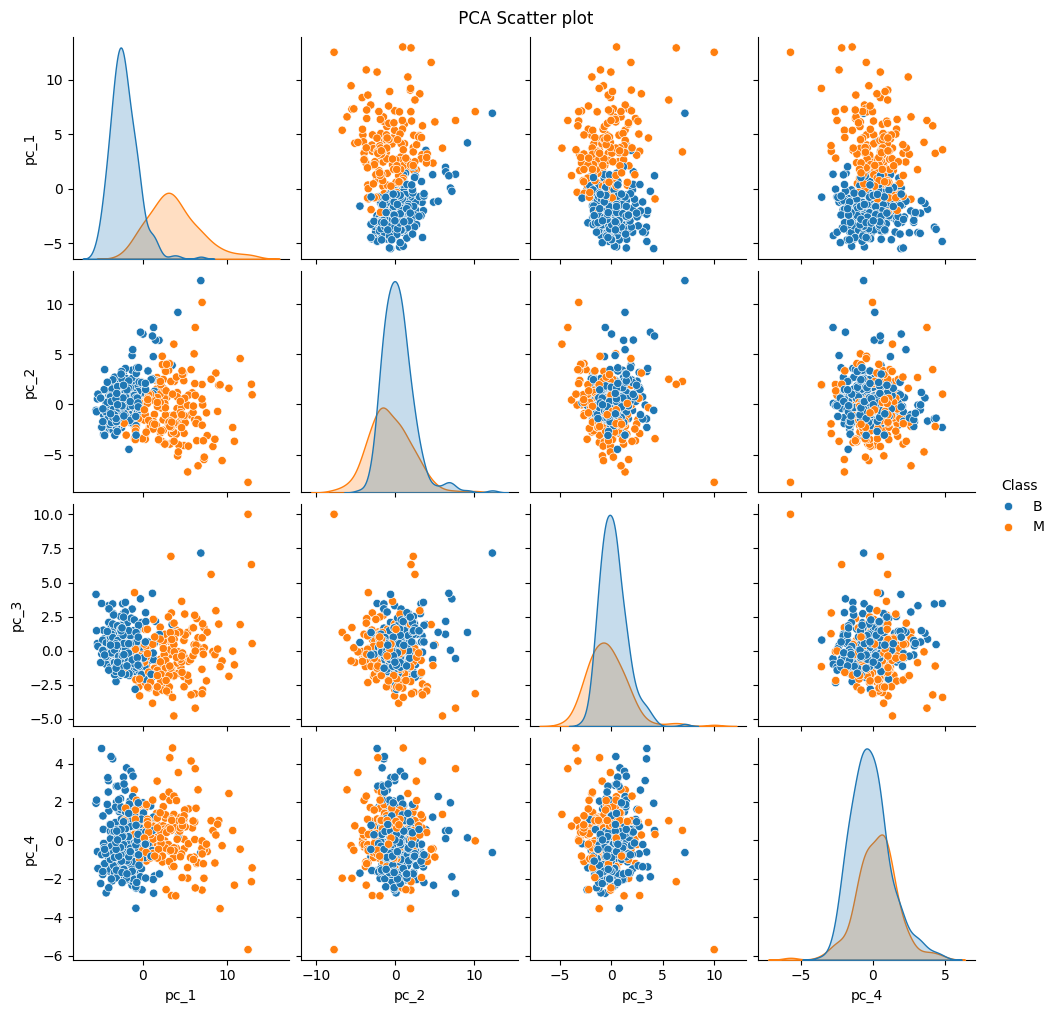
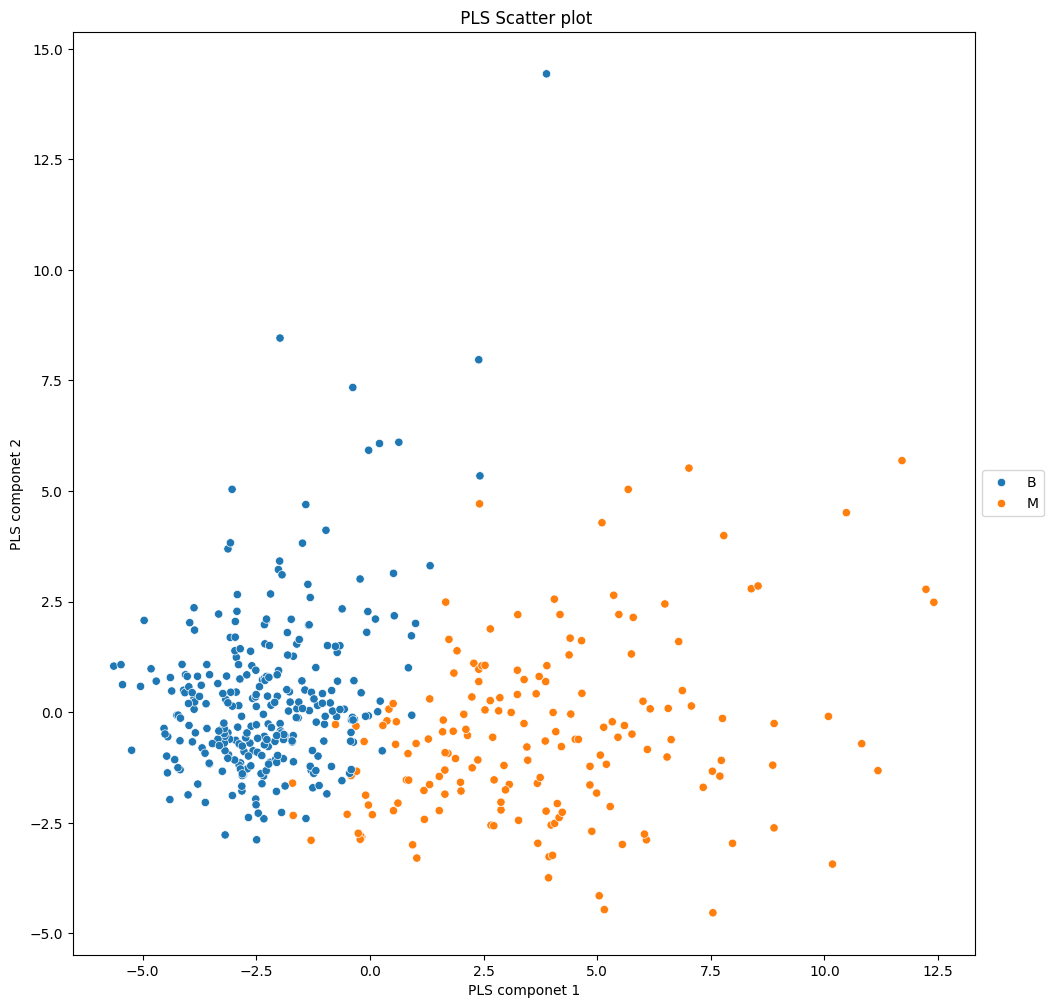
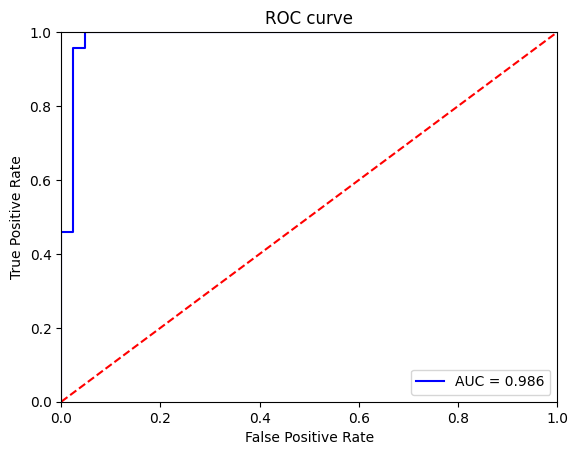
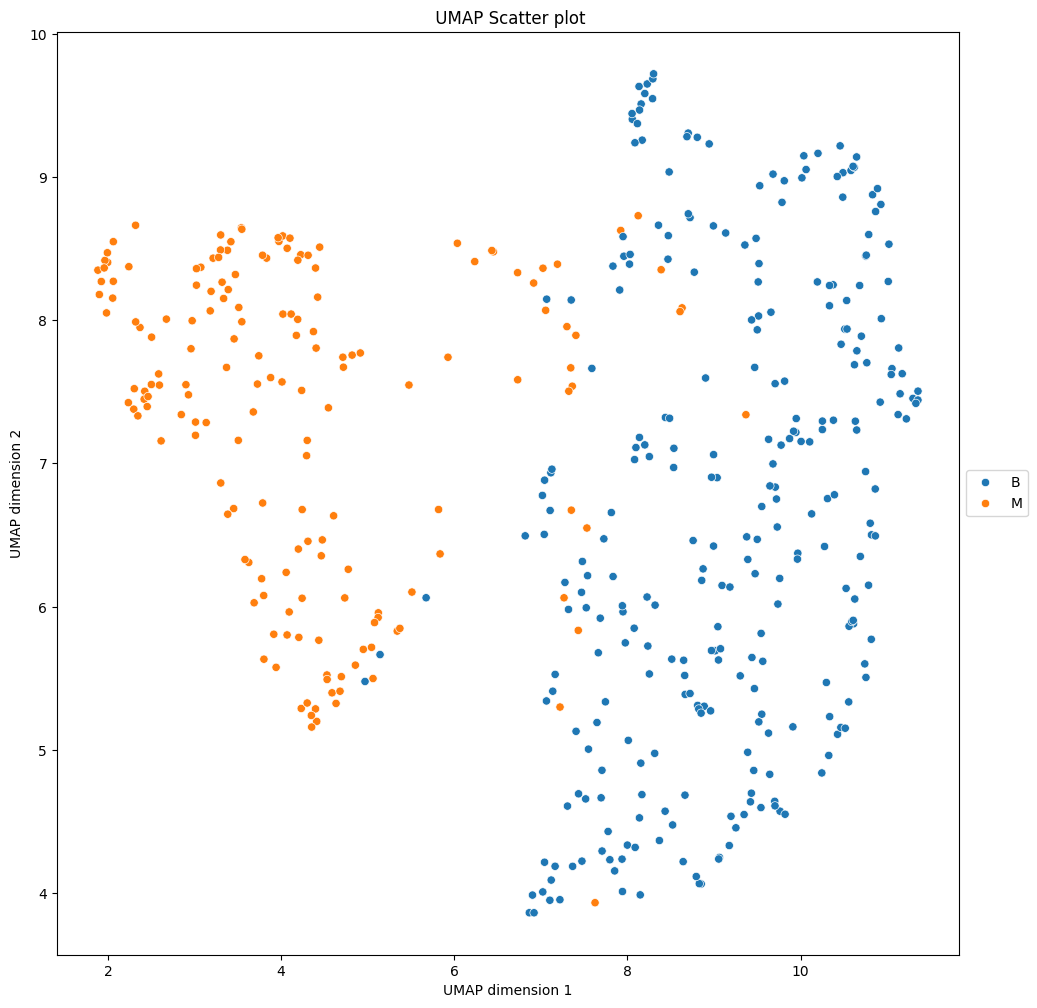
Explore analysis results with clear metrics, visualizations, and model performance summaries.
Export reports, charts, and models for easy sharing and reuse.
In today’s data-driven world, making informed decisions requires more than just raw data—it demands intelligent insights. PineBioML is designed to provide a comprehensive workflow that guides users through every step of data analysis, from preprocessing to visualization. Whether you are a data scientist, researcher, or biomedical data analyst, this software tool empowers you with state-of-the-art machine learning algorithms, advanced feature selection techniques, and dynamic data visualization tools to extract valuable insights effortlessly.